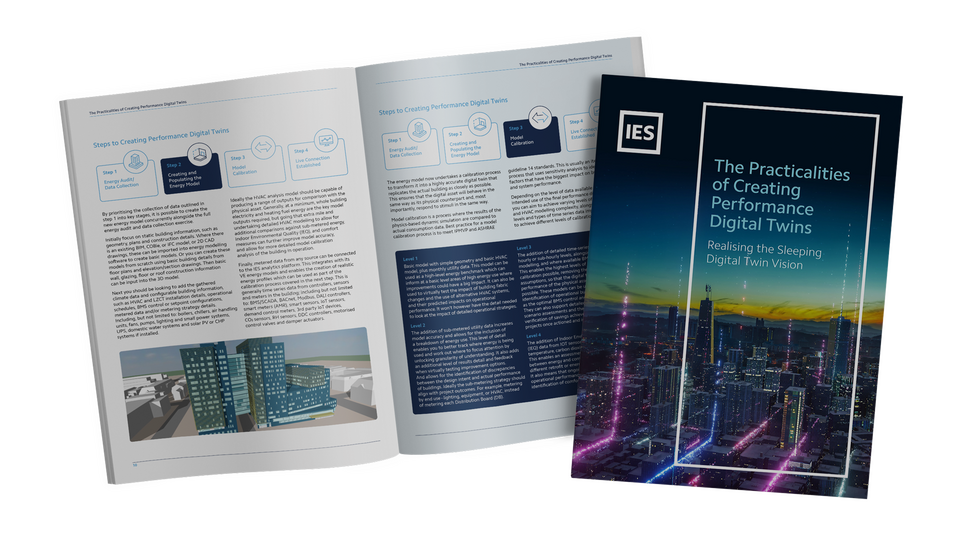
Jump to content

Articles & Publications      Shared by the Community

    IES is delighted to announce the launch of a new collaborative whitepaper which aims to foster improved collaboration between AEC practitioners and building operators to bridge the performance gap and decarbonise our buildings.

    The whitepaper advocates for a more open utilisation of digital assets and new mechanisms to overcome legal hurdles which currently impair their use as methods to accelerate the decarbonisation of buildings. 

    Spearheaded by IES, the paper brings together influential voices from across the built environment sector to discuss the importance of whole-life performance modelling and the challenges and barriers associated with industry adoption of this approach. Insight is also drawn from an industry-wide survey of 240+ AEC professionals, building owners and occupiers. 

    The paper introduces IES’ Sleeping Digital Twin initiative - the theory that dormant 3D design, compliance and BIM models which exist for the majority of the current building stock can be evolved into performance digital twins which are usable across the whole building lifecycle. 

    It is the process of unlocking these models for new use where the spirit of collaboration and openness is required. Significant questions relating to intellectual property, ownership and legal ramifications were cited as reasons for models not currently being shared with 58% of AEC consultants surveyed selecting legal implications as the main barrier to model sharing.

    With the sector overtly committed to driving down carbon emissions in both new build and retrofit projects, the use of these ‘sleeping’ models would unlock vast carbon savings and enable the delivery of better outcomes for building owners, occupiers and designers. 

    Titled ‘Sleeping Digital Twins: Exploring the appetite, benefits, and challenges of whole-life building performance modelling’, the whitepaper features viewpoints from the UKGBC, CIBSE, Introba, Sweco, Gafcon Digital, HOK, HLM Architects, Perth & Kinross Council, the University of Birmingham, and the University of Glasgow. 

    Key themes discussed within the whitepaper include: the current uptake of whole life performance modelling and the appetite for change; challenges and barriers to progress; benefits of adopting this approach; and ownership and accessibility of models. It concludes with a series of next steps that can help towards industry-wide uptake of whole-life performance modelling to move away from a culture of compliance and optimise building performance. 

    Don McLean, Founder and CEO of IES, said: “Whilst the government is backtracking on net-zero policies, the built environment sector is making strides towards change. As an industry, we are united on the need to decarbonise the world’s buildings as efficiently as possible to mitigate the worst effects of climate change. 

    “We’ve led the creation of this whitepaper to highlight the importance of utilising technology which supports whole-life performance modelling to meet net-zero targets. The tools for change already exist but are not used to their full potential which is where the Sleeping Digital Twins initiative comes in. The industry is waking up to the benefits of this method, but there are still many barriers to overcome. 

    “As a result, we need a new approach which begins with greater collaboration. A spirit of openness is needed to thaw engrained approaches and unlock the potential we have at our fingertips. There is clear appreciation for the need for better use of digital assets. 83% of AEC consultants and 66% of clients agree that better utilisation of energy models in building operation can help us achieve net-zero goals. Now, we need to take the first steps towards creating this change. 

    “This whitepaper is just the beginning of an important conversation, and we hope that it will be both informative and instructive for AEC practitioners and building operators. It aims to act as a catalyst for a shift towards better use of digital assets, closing the performance gap and decarbonising our building stock.” 

    Download the whitepaper

    To mark the launch of this landmark paper, IES and a selection of industry contributors also teamed up with The B1M for a live online panel debate to discuss the challenges and benefits of whole-life performance modelling and the Sleeping Digital Twin approach. The session is now available to watch on demand at the link below,

    Watch on demand
    Read more...
    Free Webinar - Wednesday 18th October 2023, 4pm-5pm BST
    This exclusive session, presented by The B1M in Partnership with IES, will mark the launch of a landmark collaborative whitepaper aimed at improving the tracking, measurement and monitoring of key performance metrics across the entire building lifecycle.
    Featuring results from an industry-wide stakeholder survey and in-depth insights from a range of built environment industry contributors, the paper will introduce the concept of the Sleeping Digital Twin - the theory that every building in the world most likely already has an existing 3D model, which is not currently being utilised to its full potential. Exploring the benefits and challenges of reutilising these existing models as we race towards a net-zero built environment.
    What Will Be Covered?
    This live webinar will feature a selection of industry experts from across the built environment sector that contributed to the development of this paper. Focusing on the findings of the paper, the panel will discuss the benefits and challenges of awakening Sleeping Digital Twins and taking a whole-life performance modelling approach to the way we design and operate buildings, from both an AEC practitioner and end client perspective.
    In particular we’ll explore the challenges and barriers surrounding the handover, ownership and sharing of digital models and provide clear, practical takeaways for attendees to start to overcome barriers and fully embrace the opportunities this approach presents. Attendees will also be able to ask questions of the experts in an open Q&A.
    The event will be hosted by The B1M's Fred Mills and feature expert insight from:
    Don McLean – Founder and Chief Executive Officer, IES Carl Collins – Head of Digital Engineering, CIBSE Gillian Brown – Vice Chairperson, Energy Managers Association Todd Lukesh  –  Client Engagement Manager, Gafcon Digital, an Accenture Company Chris Anton – Lead Energy Officer, Perth and Kinross Council Spaces are limited, so make sure you reserve yours today!
    Register for free here. 
    Read more...
    Organisations across all sectors grapple with the complex process of integrating ESG strategies into their operations. Government mandates, market pressures, and investment opportunities make this an obligatory journey.
    However, the journey to seamlessly integrate these strategies into the core business presents some challenges.
    In this article, I will explore some of the most common hurdles that slow down the implementation of these essential strategies and suggest ways forward.
    What ducks need to be put in a row?
    Obstacles don't have to stop you. If you run into a wall, don't turn around and give up.
    Figure out how to climb it, go through it, or work around it.
    - Michael Jordan
    Lack of consistent and standardised ESG metrics
    The lack of a single, agreed-upon set of ESG metrics stands as a significant challenge for organisations attempting to weave sustainability into their core operations. Without standardised metrics, it becomes difficult for organisations to compare their performance with others, to benchmark their progress effectively, and for investment firms to make informed decisions.
    Lack of expertise in implementing ESG and reporting on it
    Many organisations find themselves facing a lack of expertise in ESG. In-house resources for the collection and analysis of ESG data can be sparse, leading to gaps in understanding and execution. Not fully understanding the risks of implementing more sustainable solutions or not having the proper KPIs to measure progress may hold organisations back or, potentially, move them in the wrong direction.
    Continuously-evolving rules and regulations
    Uncertainty and a lack of clarity surrounding ESG standards and regulations present a significant hurdle. Pressure from investors, regulators, and organisations to come up with a valid ESG framework means that, as of now, the ESG landscape is fluid and organisations don’t know where to start or how to prioritise their efforts.
    Data is hard to get
    The spectrum of data types needed is diverse: operations’ sustainability, social aspects, and corporate governance aspects. The broad nature of the big data sets and data sources, along with their heterogeneity, presents difficulties in efficiently managing the data and making it interoperable for analysis and consumption.
    Buy-in from leadership
    The accomplishment of ESG objectives might entail short-term sacrifices that seem to clash with the organisation's overall financial performance. Hence, buy-in from leadership is necessary. Without the support and commitment of senior leadership, achieving successful ESG implementation can be daunting. As the old adage goes, ‘change starts at the top.’ If leadership is not on board, making progress can be an uphill battle.
    It’s not as bad as it looks!
    We’re definitely seeing a lot of work addressing the challenges, from new standards and frameworks being proposed to market forces accelerating cultural changes and new technology for accessing and sharing data to provide better insights.
    On the road to uniformity of frameworks and standards
    In September 2020, five major international organisations responsible for setting sustainability and reporting standards - CDP, Climate Disclosure Standards Board (CDSB), Global Reporting Initiative (GRI), International Integrated Reporting Council (IIRC), and Sustainability Accounting Standards Board (SASB) - have collaboratively outlined a shared vision for comprehensive corporate reporting.
    This shared vision for comprehensive corporate reporting combines financial accounting with sustainability disclosure through integrated reporting. The statement acknowledges the unique needs of different stakeholders and accounts for tailored disclosure systems.
    In November 2021 the IFRS Foundation disclosed the decision to establish the International Sustainability Standards Board (ISSB) to unify global sustainability disclosure. It issued its inaugural standards, IFRS S1 and IFRS S2, in June 2023.
    IFRS S1 (General Requirements for Disclosure of Sustainability-related Financial Information) presents a framework for sustainability-related disclosures. This standard necessitates that organisations disclose information regarding their sustainability-related risks and opportunities, their impacts on the environment and society, and their governance of sustainability-related matters.
    IFRS S2 (Climate-related Disclosures) goes a step further in detailing requirements for climate-related disclosures. Under this standard, organisations must disclose information about their greenhouse gas emissions, their climate-related risks and opportunities, and their transition plans to a net-zero emissions economy.
    These standards are a major leap towards achieving global sustainability reporting standards. By improving the quality and comparability of sustainability-related disclosures, these standards can accelerate the ESG agenda and aid organisations in their journey towards responsible, sustainable practices.
    Achieving excellence requires strategic changes
    Organisations often struggle to find the balance between their commitment to environmental and societal good and their need to maintain financial profitability. Organisations contend with the desire to uphold their social responsibility, while also having to meet their bottom-line goals. This can be a difficult balancing act, and there is no one-size-fits-all answer.
    An essential part of this balancing act involves prioritising strategies that align ESG, operational goals, and customers' goals. ESG initiatives should not be isolated from the organisation's core business goals. Instead, they need to be integrated into every aspect of the business. This holistic approach not only ensures the success of ESG initiatives but also has a positive impact on the organisation's bottom line.
    By aligning ESG strategies with operational and customer goals, organisations can create a unified approach that simultaneously promotes sustainability, profitability and customer satisfaction. This synergy not only accelerates the achievement of ESG goals but also builds a resilient, future-proof business model.
    It’s always all about data
    Embarking on the journey to implement ESG goals and strategies is a necessity and, for some, also a moral obligation. Achieving success ultimately depends on the capacity to navigate the intricate challenge of unravelling the pervasive "data problem." This multifaceted issue revolves around the complex task of sourcing and accessing crucial data, whether originating from internal IT and OT systems or external sources beyond the organisation's boundaries.
    A few considerations about the data problem:
    Organisations must have a clear definition of what metrics to measure based on the choice of the framework and standards to adopt and a well-defined understanding of the organisation's materiality, encompassing the most crucial environmental, social, and governance issues that have the potential to influence the company's financial value and overall sustainability. Clarity on such issues drives the definition of what data sets to use as basis for reports and achievements of ESG goals.
    Collecting data internally from operations, product owners, facilities, etc. and mapping it to metrics like “carbon emissions," as well as the gathering of social metrics, is extremely complex and labour-intensive. Furthermore, the huge amount of data to find, access, and interoperate with exacerbates the problem as it’s costly to manage and scale.
    Gathering data from the entire supply chain is expensive. It's often locked in silos, making access tricky. Moreover, organisations might resist sharing data because they can't selectively provide only ESG-relevant information.
    Regardless of the source, collected data may be inaccurate, out of context, or invalid. Using this as a basis for reporting may increase the risks of reporting the wrong outcomes, and, as a consequence, it may lead to drops in ESG ratings, accusations of greenwashing, or, more broadly, loss of reputation.
    In the face of these challenges, core technology, like IOTICS, exists and plays a pivotal role. By offering trusted technical interoperability and promoting an agile approach to sharing and exchanging raw data, information, and actionable insights, IOTICS helps organisations tackle the implementation of their respective ESG goals efficiently. IOTICS enables organisations to start small, implement a measurable ESG goal across the ecosystem of parties, and then scale organically.
    Conclusions
    Overcoming these challenges to achieve ESG goals is no small task. It requires collaboration, innovation, and a concerted effort from every part of the organisation. However, with the right approach, the right strategies, and the right tools, organisations can navigate these hurdles and make significant strides towards achieving their ESG goals. By doing so, they not only contribute to a sustainable future, but they also build stronger, more resilient businesses in the process. The path to achieving ESG goals may present challenges, but the rewards are well worth the effort.
    By working together and using innovative solutions like IOTICS, organisations can overcome these challenges and make significant strides towards their ESG goals.
    IOTICS is a powerful tool that enables businesses to share data securely and selectively, unlocking the value of data across organisational boundaries. With IOTICS, organisations can cooperate with partners, competitors, and even third-party data providers to gain new insights and make better decisions about their ESG performance.
    For example, IOTICS can be used to:
    Share data on environmental impacts across the supply chain, enabling organisations to identify and reduce their carbon footprint.
    Share data on employee engagement and well-being, helping organisations improve their social performance.
    Share data on governance and risk management, giving investors and other stakeholders confidence in the organisation's long-term viability.
    By working with IOTICS, organisations can build stronger, more resilient businesses and contribute to a more sustainable future.
    Read more...
    Built environment stakeholders are being invited to contribute their views to a collaborative industry whitepaper aimed at improving the tracking, measurement and monitoring of key performance metrics across the entire building lifecycle.
    Something that most organisations within the built environment space are united on is the need to decarbonise the world’s buildings as efficiently and quickly as possible.
    With this in mind, IES has joined forces with a range of industry stakeholders to deliver a collaborative whitepaper that is both a call to action and informative guide for AEC consultants and their end user clients. It will focus on the importance of incorporating performance evaluation and the tracking, measurement, and monitoring of key performance metrics across the entire building design process and into operation, with particular consideration of the role that improved digitisation of building performance can play in the race to decarbonise.
    The paper will also consider the concept of the Sleeping Digital Twin - the theory that every building in the world most likely already has an existing 3D model, which is not currently being utilised to its full potential.
    As part of this initiative, we are now seeking feedback on how energy models are currently being used and shared between built environment project stakeholders, and the challenges and benefits of using these models from design through into the operational phase of buildings.
    To ensure we consider a broad range of perspectives, we are keen to hear from all stakeholders involved in the lifecycle of a building: from AEC professionals to building owners, occupiers and facilities managers.
    Get involved in this important conversation by completing our short survey below.
    Link to survey: https://wss.pollfish.com/link/a3aac263-f407-44c9-899c-f2a86114f80b
    Closing date: 27th September 2023
    Read more...
    A chasm between data generated and realised value
    We are generating more data than ever before. Today, best estimates suggest that a staggering 2.5 quintillion bytes are produced every day. But there is a gap between the data generation and the value created from that data. It is this gap that we call the ‘data chasm’ and it’s a chasm that must be crossed for future digital transformation to be realised.
    An Accenture study across 190 executives in the United States found that only 32% of companies reported being able to realise tangible and measurable value from data and only 27% said that analytics projects produce insights and recommendations that are highly actionable.
    In that report, Ajay Visal, Data Business Group Strategy Lead, Accenture Technology said: “Companies are struggling to close the gap between the value that data makes possible and the value that their existing structures capture—an ever-expanding chasm we call 'trapped value’.” The World Economic Forum estimates that we could secure around $100 Trillion of incremental gross domestic product (GDP) growth if we could fully unlock the value of this data.
    What is the cause of this 'trapped value'?
    For insights to be generated, first, data must be organised into datasets. Datasets are rows and columns (similar to an excel spreadsheet) organising the data into groups and categories. Once this has been done, the data can be analysed. Insights are generally derived from multiple data points in a certain sequence to indicate something. Typically, this involves code being developed to ‘query’ the data in a particular way, looking at particular rows and columns in combination.
    The sheer volume of data that we are generating today makes this challenge difficult and time-consuming. But it’s not just time. People need to know what to look for before they start this process, meaning they must be highly confident of the questions they want to ask of the data before they start. Given insights often lead to questions, there is a cap on the value that one can realise from data following traditional methodologies.
    What’s more, the value of an operational insight deteriorates over time. If the insight that something is going to be delayed is provided hours after the shipment eventually arrives, it’s useless. So, to provide real value, these insights need to be generated in real-time.
    Implementing the flexibility needed to cope with new data, being able to change the questions you are asking of the data and ensuring insights are captured in real-time are difficult obstacles to overcome. But they are critical to unlocking the ‘trapped value’ we speak of.
    A perpetuating problem
    One of the business contributors of data generation in recent years, and a source that is expected to increase data generation exponentially, is the increasing adoption of Internet of Things (IoT) systems and hardware. As the graph illustrates below, the projected increases in data generation track almost exactly to the IoT deployment projections.
     
    IoT sensors provide real-time data for things. This could be the location of an asset, the temperature of a fridge, etc. IoT offers enormous potential to use data to improve operations, businesses, processes, experiences, etc. But it also adds to the problems already described in this article.
     
    Firstly, it offers a means of much higher velocity data (near real-time). This velocity makes it harder to find insights retrospectively (and order of magnitude more data to sift through). Secondly, IoT data is less structured (referred to as unstructured/semi-structured data). Unlike the data from typical back-office systems that are nicely formatted, IoT data is communicated in the form of JSON packets and images. And finally, IoT data is more volatile. Unlike systems transferring data from cloud to cloud, IoT devices communicate over the air using cellular, and Bluetooth and are more prone to loss/corruption (due to communications protocols, etc.).
    Technologies like data warehouses simply can’t cope with the velocity, volatility, and unstructured nature of IoT data. To this end, data lakes emerged as the new go-to technology for big data projects. Data lakes are specifically designed to cope with these types of challenges, capable of handling high volumes of structured, unstructured, and semi-structured data at high velocity.
    Many businesses deployed a data lake in one form or another – to centralise the huge volumes of data they were generating, critically including IoT data. However, most were still unable to garner the actionable insights they deserted, or at least had to exert enormous additional effort and development work to do so. This is because just putting all the data in one place doesn’t provide the structure needed to be able to analyse the data properly. The challenges of organising and structuring the data do not get any easier. The ability to access data is made easier, but the ability to use that data is not.
    Silver bullet technologies
    With these problems still prominent, some technologies have emerged as potential ‘silver bullets’. Artificial intelligence, for example, has been pitched as a tool that can scan huge volumes of data (such as that of a data lake) and find those hidden insights. But of course, these technologies most often fail or at least, only generate moderate insights that have limited business impact.
    Other technologies such as blockchain have been presented as a means of solving many of today’s challenges with data. But again, they have fallen short, with many large organisations not yet claiming to gain tangible value from their data.
    None of these emerging technologies provides a solution to organising the huge volumes of data in a way that provides the flexibility, agility, and real-time nature needed to deliver the transformative insights businesses need to realise tangible value from their data. Technologies like Artificial Intelligence and blockchain provide tools to take data to new levels. But to unlock them, and start realising tangible value from data, there is a step before – a step that requires a totally new approach to data.
    Looking at data through the lens of the entity
    If we are to cross the data chasm, a completely new approach is needed. Instead of looking at data in a linear way, and thinking about it as data, we need to change our perspective. We need to start looking at data through the lens of the entity.
    But what does this mean? Today, we typically think about data as bits and bytes, in rows and columns, as datasets. But when we, as human beings look at the world, we don’t see data, we see things described by data. We don’t see things like age, height, and weight as individual things. We see a person that has a particular age, height, and weight. This may sound obvious, but it’s a critical perspective in crossing the data chasm.
    By looking at the data through the lens of the entity, each datum belongs to some ‘thing’. It is attributed. By treating data in this way, you create a natural framework that can organise data in real-time, at a highly granular level. But it goes further…
    In the real world, things have relationships with other things. A person has a relationship with another, mother, father, son, or daughter; a person has a relationship with a house; a house with a street; a street with a city. Within relationships, ‘things’ have defined roles and functions. A house is the home of a person. Or one person is the father of another. Of course, the relationships can change over time, but whilst they exist, they create links between real-world things, and critically, they create meaning. It is this meaning that helps to uncover insights hidden in large datasets in real time.
    How can this be achieved through software?
    What we are essentially describing is a digital twin - a virtual representation of a real world process or system for the duration of its lifecycle, that serves as a digital counterpart to aid simulation, monitoring, testing, and maintenance. The use of digital twins is rising across all industries, with notable interest in sectors like supply chain and healthcare.
    Digital twins create a framework through which data can be looked at through the lens of the entity. Instead of individual rows of data, you have objects that have dynamic relationships with other objects. The digital framework enables data to be structured in this way and helps to overcome some of the key challenges outlined in previous paragraphs.
    What’s more, the digital twin is established irrespective of the question. Think about it, it’s just a virtual representation of the real-world. Once established, questions can be asked of the digital twin. This sort of flips the previous notion of the analysis process. Rather than coming up with the question first and then organising the data, the data is organised and then the questions are asked. This provides huge flexibility with regard to what questions one can ask of the data.
    Ontology and digital twin
    ‘Ontology’ is a central concept when considering digital twins. A term that has been somewhat hijacked by the data community originated in metaphysics – a branch dealing with the ‘nature of being’. In data, it means ‘a set of concepts and categories in a subject area or domain that shows their properties and the relations between them’. But in essence, it is all about giving the data meaning.
    Ontology is the science that sits behind the digital twin. It is the way that data is structured and organised in a way that allows true reflection of the real world, delivering true meaning from data. It is somewhat of an emerging concept and there are many variations and interpretations, but if delivered correctly, it is enormously powerful.
    The concept of a semantic data foundation
    A digital twin can be agnostic from a particular question. Data is organised and attributed to entities to depict the real-world. It is not structured and organised to ask a specific question. This is a shift.
    The real advantage of this concept and this approach is the flexibility it provides. Future questions can be asked of the data and answered much more quickly. New data can be introduced but fit straight into the structure, integrating seamlessly with other data from other sources.
    In this context, the digital twin becomes foundational, organising data in a way that delivers meaning but without being limited to address specific questions.
    We call this a semantic data foundation. A foundation from which new services can be delivered rapidly. A foundation from which new insights captured more easily. A foundation from which businesses can unlock tangible value from data. The key to crossing the data chasm is to look at data through the lens of the entity. The way to do this is to create a semantic data foundation otherwise known as a digital twin.
    In summary
    In summary, the key to crossing the data chasm is not a silver bullet technology but instead, a way of looking at data. It’s a perspective shift, from looking at data in tables to looking at data as attributes of things.
    Businesses that can successfully make this shift and adopt software that enables them to do so, will realise tangible value from their data, gaining significant competitive advantage and accelerating ahead of their competitors.
    Read more...
    Fathom, a global leader in water risk intelligence, has released a new US Flood Map; a cutting-edge tool that provides the most comprehensive climate-driven flood risk information for the United States.

    Responding to the inconsistent and incomplete coverage of existing datasets, the US Flood Map leverages the latest observation, terrain and climate information to present a consistent view of flood risk for all major flood perils, climate scenarios and time horizons. Thanks to its team of scientists, Fathom’s US Flood Map offers the most advanced hazard and risk information for the country, at 10m resolution.

    Fathom’s US Flood Map empowers engineers, climatologists, GIS professionals and asset owners and operators to make swifter, more informed decisions for their projects at pace and with confidence, using this comprehensive resource. Offering a uniform view of current and future flood risk in the US, the flood map enables users to enhance risk assessment and climate risk reporting, and future-proof their assets.

    The United States has experienced a significant increase in the severity, frequency and unpredictability of extreme weather events, due to factors such as climate change, natural variability, population growth and urban development. The impact of these catastrophes are immense and, if not mitigated sufficiently, will continue to impact critical infrastructure and put communities at risk. Emerging technology now means that we have more information than ever before to effectively manage exposure to flood risk in the US, and prevent unorganized development in high-risk areas.

    Traditional approaches to mapping flood risk are highly detailed but not scalable due to resource, time and financial demands. Fathom's methodologies, independently validated by organizations like USACE and built upon an array of scientifically robust and peer-reviewed research by Fathom’s scientists, enable efficient and robust flood hazard assessment without compromising accuracy.

    Notable features of the US Flood Map include:
    Comprehensive coverage: Fathom's US Flood Map is the first to cover every river, stream and coastline in the country, providing an unprecedented level of detail and accuracy. Unrivaled terrain data: the most accurate US terrain data in existence, thanks to an approximate doubling of LiDAR data collected since 2020 (now covering 872,000sqkm of the US). Lower quality elements of the publicly available data are supplemented by Fathom’s bias-free global ground terrain map, FABDEM. Unparalleled representation: With FEMA’s coverage limited to major (approximately 60% of) river channels and prioritizing densely populated urban areas, Fathom’s US Flood Map offers a consistent and unified view of flood risk across the entire country and 100% of river channels. Climate conditioned: By integrating Fathom’s Climate Dynamics framework into the US Flood Map, Fathom is the only firm able to demonstrate the impact of climate change on flood risk under all emissions scenarios, temperature changes and time horizons up to the year 2100. Updated methodology: A revised methodology provides the most complete flood defense dataset. Dam simulation: Using a machine learning model trained on all available observations, Fathom has, for the first time, estimated the influence of all 84,000 dams on extreme flows nationwide. In addition, by applying detailed land use and building data to varying surface parameters, the new US Flood Map explicitly simulates how land use impacts the flow of water across the entire country; an unrivaled feature.Risk Scores: Distilling complex depth-frequency data into an easily digestible and consistent metric of how flood risk varies from one location to another. The next evolution of modeling: Previous versions of Fathom’s independently and collaboratively created US Flood Maps, such as Fathom-US 2.0 are no longer being updated and therefore rely on outdated information. The new US Flood Map harnesses the latest intelligence, with all model components that use observational data updated to 2022, for an up-to-date view of risk.  
    A range of mechanisms can be used to access the data, including through a self-service API, on premises and via the Fathom Portal - a user-friendly platform for companies or teams without in-house geospatial capabilities.

    For more information about Fathom and the US Flood Map, please visit our US Flood Map webpage: https://www.fathom.global/product/global-flood-map/us-flood-map/


    Read more...
    Digital Twins need Information Management using BIM for the Built Environment
    nima (formerly UK BIM Alliance) has a vision, to create a built environment sector that is transformed by being able to exploit purpose driven data. Anyone who is familiar with the UK’s standards for BIM, from the original British Standards suite to the new ISO and UK BIM Framework, understands that BIM has always been about life cycle information management - making sure organisations have a defined process for specifying, procuring, delivering, assuring, storing, presenting, and exploiting whole life information. nima are not leaving BIM behind, but they are evolving how they describe it.
    Digital twins (digital world and physical world) for operating and maintaining the built environment need information management using BIM. Information management using BIM is a key foundation for enabling structured and interoperable data – a primary fuel from the “As Designed Model” and “As Built Model” for digital twins.

    Based on: The University of Sheffield AMRC
     
    Information Management (IM) Frameworks
    IM frameworks aim to establish the building blocks that are necessary to enable effective management of 3D models, data, and documents, and deliver structured interoperable data across the built environment lifecycle.  IM frameworks enable secure, resilient interoperability of data, which is at the heart of digital twins. It is a reference point to facilitate data use in line with security, legal, commercial, privacy and other relevant trustworthy needs.
    The Pathway Towards an Information Management Framework: A Commons for a Digital Built Britain, sets out the technical approach for the development of an Information Management Framework (IMF) to enable secure, resilient data sharing across the built environment.  The publication of the report by the former Centre for Digital Built Britain is a key step towards a National Digital Twin. To guide the development of the IMF, nine values were set out by the Centre for Digital Built Britain. These values are known as the Gemini Principles.
    Purpose - Digital Twins must provide benefit to the general public, enable improvement in performance while creating value and must provide real insight into the built environment. Trust – This is a major part of the idea behind the National Digital Twin. A Digital Twin must enable security and be secure, it must be as open and transparent as possible, and built using legitimately good-quality data. Function - A digital twin must function effectively. A federation of digital twins must be based on a standard connected environment, there must be clear ownership of the twin, as well as clear governance and regulation. There is also a requirement for digital twins to adapt as the available technology continuously evolves. A related IM framework is the UK BIM Framework (GIIG) Information Management Platform (IMP). The IMP sets out the steps organisations can take to develop a portfolio level digital information management strategy that can be progressively assembled from existing, and, if necessary, new enterprise systems, to capture and maintain an ISO 19650 compliant asset information model for each of its assets. The IMP can assist in an organisation, where relevant, in meeting stated government construction policy aims, namely, those contained in the Construction Playbook and Transforming Infrastructure Performance: Roadmap to 2030. An IMP is a cornerstone for the development of digital twins and future connected national digital twins.
    Information Management Using BIM
    Information Management (IM) is the process by which an organisation specifies, procures, receives, assures, stores (via a system of record) and presents its data to perform its core business across asset lifecycle activities. IM using BIM can occur without strict adherence to IM frameworks, but greatly benefits from its structure and process. IM using BIM is enabled by the application of information management frameworks and supports the development of trusted data for digital twins and future connected digital twins.
    Accuracy, completeness, uniqueness, validity, timeliness, and consistency are all qualities of 3D models, data and documents that is enabled by the effective use of information management.
    Accuracy – 3D models, data and documents are correct in all details and is a true record of the entity it represents. Completeness – 3D models, data and documents have all or the necessary attribute values relative to its intended purpose. Uniqueness – a single representation exists for each entity or activity. Validity – 3D models, data and documents conform to all standards expected. Timeliness – 3D models, data and documents are easily accessed or available when required and is up to date. Consistency – an entity that is represented in more than one data store can be easily matched. 1Spatial works with organisations across the built environment to ensure all the above qualities of data, enabled by the effective use of automated information management.
    Business Operations
    Business operations is the process of using trusted data and information to carry out organisational functions. Organisations responsible for the built environment use data and information to measure, model, monitor and manage.
    Digital Twins
    Digital Twins involves business model innovation, and operational improvement organisational changes. IM typically provides structured and accurate data from “As Designed Models” and “As Built Models” to support the adoption of digital twins for operational improvements. Digital twins are used to improve measuring, modelling, monitoring, and managing/maintaining the built environment.
    An IM framework enabled by the application of information management using BIM supports the development of trusted data for built environment operational improvements and digital twins.
     
    Summary
    IM frameworks, IM using BIM and digital twins are symbiotic.

    An IM framework needs IM using BIM and IM needs an IM framework to support the development of trusted data. Digital twins need both IM frameworks and IM using BIM to succeed and enable great things to happen.
    Author: Matthew White, Head of Built Environment, 1Spatial 
     
    Read more...
    A big thank you from 1Spatial
    The inaugural Connected Digital Twins Summit – Systems thinking for a smarter world took place in June. The Digital Twin Hub and Connected Places Catapult hosted one-day hybrid event showcased the latest cross-industry business applications for connected digital twins.
    1Spatial would like to thank the Connected Places Catapult and the Digital Twins Hub. The Summit convened over 900 attendees including senior-level policymakers, corporate asset owners, solution providers, academics, and investors. From the Ministerial Address by Rt Hon Jesse Norman MP (Minister of State for Transport, UK) through to the line-up of keynotes, SME showcases and immersive case studies demonstrating the power and ROI of digital twins in different contexts – the summit had it all and 1Spatial are ready for the Connected Digital Twins Summit in 2024.
      Great things happen with digital twins and trusted data for our built environment
    1Spatial work with organisations across the built environment to deliver increased productivity, reducing or avoiding costs and increasing output by delivering trusted data with automated information management. 1Spatial achieve positive outcomes for organisations by enabling the implementation of information management (data governance) frameworks for digital twins.
    1Spatial posted a pre Connected Digital Twins Summit blog article focusing on great things happen with digital twins and trusted data for our built environment. Information management (IM) frameworks, information management and digital twins are symbiotic. An IM framework needs IM and IM needs an IM framework to support the development of trusted data. Digital twins need both IM frameworks and IM to succeed and enable great things to happen.
    Who needs to manage information about our built environment?
    Many stakeholders, including external contractors, contribute information about the built environment throughout its lifecycle. Where information is being used to manage strategic built environment aspects - such as road networks, airports, flood defences or power stations - challenges may arise when information needs to be integrated from multiple data owners.
    Interoperable information management is needed for:
    Policy and programme planning Pre-Contract Contract Delivery Handover Operations End of Life Discrepancies in data formats, currency and granularity can lead to varying levels of accuracy, quality, and consistency.
    To create strong data foundations that allow organisations to have confidence in their information, information quality is critical. Rather than resorting to a one-off manual clean-up process, it is important that organisations establish an information correction or enhancement regime to identify and rectify errors according to a set of predefined criteria or rules.
    Organisations with large amounts of legacy data, in old IT systems, are especially prone to this challenge. Defined standards and structures can significantly improve information quality, completeness, and reliability. By applying information quality and governance principles, smarter information assurance becomes a process rather than an event and ensures the integrity, interoperability, availability, and compliance of built environment information for digital twins. These processes are critical in wider built environment supply chain projects and developing a strategy to create and maintain strong data foundations will benefit the wider built environment and sustainability of digital twins.
    Journeys towards digital twins
    Successful journeys towards digital twins and connected digital twins are dependent upon information management frameworks and automated information management approaches. Manual checking of information, manual mapping to documented standards and challenges with integrating disparate information all contribute to extended delays in making information available to users for organisational operational purposes and digital transformations, for example, digital twins.
    Automated information management approaches for extracting information, checking information against standards, and information integration will make higher quality, consistent information available to users sooner.
    1Spatial’s CTO, Seb Lessware gave a presentation during the Connected Digital Twins Summit Gemini Live Call session. Seb talked about the National Underground Asset Register (NUAR) as an example of enabling information management frameworks.
    How we can help
    1Spatial’s products automate information management in a repeatable, consistent, and scalable way.
    We are working with organisations across the built environment to ensure industry-leading digital twinning of the physical built environment, delivering automated information, that has the capacity to meet future demands.
    Author: Matthew White, Head of Built Environment, 1Spatial  
       
    Read more...
    Why is Information Assurance Important for the Built Environment?
    For the purposes of this article, information assurance refers to verifying and/or validating information.
    Organisations want to deliver increased productivity, reduce or avoid costs, and increase their output. 1Spatial help achieve positive outcomes for organisations by delivering automated information assurance using specified requirements, rules, and reporting.
    The Government Transforming Infrastructure Performance: Roadmap to 2030 is the Infrastructure and Projects Authority’s flagship programme to lead system change in the built environment. Its purpose is to transform how the government and industry decide to intervene in the built environment, to drive a step change in infrastructure performance.

    The roadmap includes an information management mandate, stating that organisations should have a digital mechanism for defining their information requirements and then procuring, receiving, assuring, and storing, via a system of record, the information that they procure.
    The GIIG (part of UK BIM Framework) aims to help organisations deliver, and benefit from information management, by developing guidance for specifying, procuring, delivering, assuring, storing, presenting, and exploiting built environment information.

    Source: GIIG
    1Spatial supports the work of the GIIG and recently joined nima (formerly UK BIM Alliance) as a bronze patron, to help make information management across our built environment business as usual.
    Information management is not effective unless the information is of an agreed quality and standard before being ingested or integrated into a larger system or shared for wider consumption and decision-making.
    Multiple stakeholders (asset owners, contractors, and suppliers) capture, hold and share information about built environment assets throughout the lifecycle of assets. Where information is being used to manage strategic built environment assets - such as buildings, road networks, airports, flood defences or power stations - challenges may arise when information needs to be integrated from multiple data owners.
    Discrepancies in file exchange formats, data currency and data granularity can lead to varying levels of accuracy, quality, and consistency.
    To create strong data foundations and “the golden thread” that allow organisations to share information and have confidence in their information, information quality is critical. Rather than Information Managers or Document Controllers for example, resorting to repetitive manual information assurance processes, it is important that organisations establish information management and an information assurance regime to identify and rectify errors according to a set of predefined requirements and rules.
    Organisations with large amounts of legacy data, in old IT systems, are especially prone to this challenge. Specified requirements, for example, an Information Delivery Plan (IDP), Project Information Requirements (PIR), Asset Information Requirements (AIR) and specifications, for example, Information Delivery Specification (IDS), can significantly improve information quality, completeness, and reliability, via information assurance. By applying an information management framework, objective information assurance becomes an automated workflow process rather than an event and ensures the integrity, interoperability, availability, and compliance of built environment information.

    Source: GIIG
    Automated information assurance improves the quality, availability, and timeliness of the information available to organisations – facilitating more efficient and effective decisions and investments.
    Who Needs Information Assurance?
    Many stakeholders, including external contractors (appointed parties) and their suppliers, contribute information about the built environment throughout its lifecycle to asset owners (appointing parties). Where information is being used to manage strategic built environment aspects - such as road networks, airports, flood defences or power stations – challenges may arise when information needs to be integrated and assured from multiple data owners.
    Information assurance is needed for: Policy and programme planning Pre-Contract Contract Delivery Handover Operations End of Life Why Rules?
    Rules are a great way to help organisations maintain information quality and reliability across the supply chain (asset owners, contractors, and suppliers). They are a great way to explicitly assure information against specified requirements. They also become an independent way to catalogue, version and report what assurances are performed on information so that organisations can collaborate with all users. This allows organisations to be clear with everyone about the context organisations have used to determine that information is fit for purpose.
    A Rules Engine Approach to Information Assurance
    A Rules Engine (software application) is, at its core, a mechanism for executing business and technical rules from specified requirements to a dataset. Business and technical rules are simple statements that encode business decisions of some kind. It provides a true or false result depending on whether the input data matches that rule. Rules have always been considered a part of Artificial Intelligence although in a rules-based system, the rules are explicitly defined by experts rather than being automatically inferred from possible subtle patterns in data.

    Information management assurance using requirements, rules, and reporting at the Environment Agency
    The Environment Agency is one of the central government early adopters for interoperable built environment information management, using specified requirements and rules to drive efficiency and productivity.
    Source: Environment Agency and GIIG
    The Environment Agency is a non-departmental public body sponsored by the UK government’s Department for Environment, Food and Rural Affairs (Defra). With responsibility for protection and enhancement of the environment across England, Flood and Coastal Risk Management deals with approximately half of the Environment Agency’s annual expenditure to build, maintain and operate flood defences, maintain rivers, and provide effective flood warnings to communities.
    Information about its extensive flood and coastal defence assets, which are an essential part of the national built environment, is as important as the physical assets themselves. Robust information management is therefore required to ensure that the Agency’s information is findable, accessible, interoperable, re-usable and fit for purpose. With most of Environment Agency’s information commissioned from contractors and their suppliers, it needed to transform the acceptance and assurance of information coming from difference systems. The “Data store, Rules and Visualisation” (DRV) service is a key component of going digital and transforming Environment Agency’s information management and specifically information assurance.
    To give confidence in the information provided by its contractors and their suppliers, the Environment Agency use 1Spatial’s 1Integrate product and Safe Software’s FME Flow (formerly FME Server) product to deliver automated asset information assurance. The integrated DRV service assures geoCOBie data against different specified requirements, for example, Information Delivery Plan and Data Requirements Library.
    A hosted FME Flow looks for new geoCOBie files in an Excel format, that have been uploaded by contractors to the Environment Agency Common Data Environment (CDE), Asite. New geoCOBie files are parsed and loaded into a staging area in preparation for assurance using FME Flow. The 1Integrate “central rules book” is made up of 170 business and technical rules that checks the geoCOBie data. If the geoCOBie data passes the required rules, an approval report is generated. If the data fails to meet any of the rules, a failure report is generated, advising the contractor of the issues found. This report can be used by the contractor to correct the issues before re-submitted files back to the DRV for assurance.
    Accepted geoCOBie data whose workflow status indicates that it is ‘For Publication’, is imported into the DRV structured data repository, a Microsoft Azure SQL Database, ready for visualisation and re-use across the Environment Agency processes and associated business systems, for example asset information management, business intelligence and GIS.
     
    1Spatial are working with organisations across the built environment to build and maintain structured data repositories (data foundations) of the built environment, by automating information management assurance throughout the built environment lifecycle. Structured data repositories of the built environment have the capacity to meet operational needs and provide foundations for digital transformation, e.g. digital twins.
    If you would like to find out more, take a look at this on-demand “The Road to Smarter Asset Information Assurance” webinar, which includes presentations from the GIIG, Environment Agency and 1Spatial.
    This article can also be found here: The Journey to Smarter Information Assurance for the Built Environment | 1Spatial 
    Author: Matt White, Head of Built Environment, 1Spatial


    Read more...
    The Challenge & Objective
    Previous work by Energy Systems Catapult has identified data as the single biggest enabler of a decarbonised, decentralised and digitised energy future. Fortunately, several organisations in the energy sector are now offering open data platforms, such as the National Grid ESO Data Portal, UK Power Network’s Open Data Portal or the Balancing Mechanism Report Service (BMRS) provided by Elexon. However, to unlock the true value of this data, disparate data sources often need to be joined together.
    One open-source (OS) tool that tries to address this requirement is the “Power Station Dictionary" (PSD), which provides mappings of electricity generating assets in the UK between various data sources, such as Elexon and the Renewable Energy Planning Database. However, when evaluating existing OS energy data science projects, I found that most failed to build on work such as the PSD, leading to different data scientists and researchers repeating time-consuming data mapping tasks. Hence, I wanted to explore the value and challenges of building upon an existing OS data project when developing a common energy system use case. Doing so, I set out to achieve the following objectives:
    Develop a useful dataset of live UK electricity generation by location (e.g. for mapping of this data), and making this publicly available (Link to GitHub repository) Document the work and outputs to help others trying to achieve a similar objective better understand the data sources that were used and the logic to derive the live generation figures Better understand the landscape of existing OS energy data projects in the UK, and how they could be reused in my project Understand the barriers and opportunities related to reusing existing OS tools Contribute to the existing OS projects and feedback to their creators  
    The Data: Power Station Dictionary (PSD)
    One of the key inputs into this project, the PSD is available via a GitHub code repository and also accessible via an end-user user-friendly website. It currently provides mappings between 15 commonly used energy datasets and databases, and contains information about more than 270 electricity generating assets.
    Most useful from this package was the information about the power station fuel types and, more importantly, the power station locations in latitude and longitude. To my knowledge, there is no other single database for UK power generators' locations which means this information would otherwise need to be collated from government datasets, such as the Renewable Energy Planning Database, and through time-consuming online research (e.g. Google Maps, Wikipedia).
    It is possible to install the PSD as a python package, allowing integration of the data into other applications and various programming languages using the “Frictionless Data Tabular Schema”, a standardised format for expressing metadata and linking datasets. However, for the purposes of this project, the main data sources required within it were the dictionary IDs, “plant locations”, “common names” and “fuel types”, all of which are available on the repository as CSV files and can easily be accessed.
     
    The Data: Balancing Mechanism Reporting Service (BMRS)
    The second main source for data is the electricity generation data. The BMRS provides various data reports about electricity generation and demand in the UK, many at half-hourly level to match the 48 settlement periods (SPs) of the UK Balancing Market. This data was accessed using the “Elexon Data Portal” Python package which greatly simplifies querying of the BRMS API, for example by automatically translating SPs into human-readable timestamps.
    Historic generation per generator is usually published five to seven working days after the actual generation date which makes it difficult to see what the live generation output in different locations would look like. This data is ingested into the developed pipeline for showing historical generator outputs. Currently, the pipeline is capped to retain this data for 45 days to avoid excessive duplication of data that can easily be queried via a public API; however, this parameter can easily be changed if a particular use case required it.
    Live generation data is contained within the Physical Data of the BMRS which, in turn, breaks down into five subcategories, which are defined in detail on this website:
    Final Physical Notifications (FPN): the best estimate of the level of generation a generator expects to export in a SP. This must be submitted one hour prior to start of the SP, also referred to as “Gate Closure”. Quiescent Physical Notifications (QPN) – optional: a series of MW values and associated times expressing the volume of generation or demand expected to be generated or consumed (as appropriate) by an underlying process that forms part of the operation of a particular generator. Maximum Export Levels (MEL): the maximum power export level of a particular BM Unit at a particular time. For example, in the case of an outage affecting a certain generator, this could override their previously notified generation levels. Minimum Import Levels (MIL): the minimum power import level of a particular BM Unit at a particular time. Bid Offer Acceptance Levels (BOAL): a formalised representation of the purchase and/or sale of generating capacity by the System Operator (i.e. National Grid) to balance the transmission grid. For the purposes of understanding live electricity generation at the half-hourly level, the FPN, BOAL and MEL data is most relevant. It is important to understand that, although SPs are distinct half-hourly periods, most of the time, the physical data is not provided in neat half-hourly intervals as generation levels often bridge two separate SPs. BOALs can also change multiple times and override each other within any SP if the System Operator (National Grid) requires this to be the case, for example in the case of wind energy curtailment. Hence, an important task within this project was to extract the most recent information from the different notification messages and aggregate it so that the half-hourly generation volumes (in MWh) could be calculated based on the multiple generation output levels (in MW) that a generator could have within any SP. To achieve this, the physical data was resampled from records with start and end times to minutely generation-level records from which only the latest notification was retained.
    Following development of this method, it was validated by testing several days of aggregated “live” physical data data against the historic generation per generator, once the historic data had been published. Generally, this data reconciled relatively well, particularly for conventional generators with high levels of control over their generation (e.g. nuclear or gas-fired power stations). However, some larger discrepancies were found for some of the wind farms included in the dataset. These were questioned with a subject matter expert in this area who clarified that such discrepancies would largely be due to poor forecasting, i.e. some windfarms consistently predicting to generate at 100% of their installed capacity rather than updating their FPNs with their internal generation forecasts. It is worth noting that the incentives for these generators to provide accurate forecasts to the BMRS service are currently weak, and as a result anyone interested in future generation is likely to have to invest in creating their own forecasts.
    In the data pipeline, once cleaned, the most recent live generation data of the past days is appended to the already aggregated historic generation data. The generator location information from the PSD is then joined to finalise the dataset to output it in CSV format ready for further analysis. From this location, it can now be accessed by anyone interested in using it, for example to create live mapping visualisations of electricity generation in the UK. A conscious decision was made not to build a new energy map, as several great visualisation platforms for UK energy data already exist. However, an example of what this visualisation could look like can be found here.
     
    Automating the pipeline and future development avenues
    The pipeline was written to query the BRMS on a half-hourly basis and request updates from the PSD once per week. To automate both update cycles, GitHub Actions were deployed that automatically execute the relevant python scripts at the preset intervals. With this process, the pipeline has been running successfully since the beginning of April 2023.
    The project also highlighted several future areas where additional contributions to create a live generation dataset for the UK could be made:
    Integration of solar PV and other embedded generation: Currently the dataset only includes data from generators which are part of the balancing mechanism, namely larger generators connected directly to the UK’s electricity transmission network. Future iterations could attempt to integrate data about embedded generation or Solar PV, e.g. that available from Sheffield Solar, to provide a more comprehensive picture. Integrate more accurate wind forecasts for the wind farms with the worst forecasts: This would provide the benefit of increasing the accuracy of the individual windfarm’s live generation. Add wind curtailment data to the dataset: Curtailment of wind energy can easily be derived from the BOAL data; hence, it could be added to the dataset with relative ease.  
    Outcome and Learnings
    From delivering this project, I discovered several useful learning points that could inform future projects to develop OS energy data analytics or data science use cases:
    Open-source mappings between different IDs are invaluable, but hard to maintain and publicise without strong examples of how they can be used in practice. By publicizing this project, I’m hoping to raise the awareness about their existence. When building foundational open-source data tools it's important to provide documentation focused on end-users as the existing documentation is often aimed at industry experts rather than novices. This, in turn, creates barriers for innovators or individuals newly entering the field. Data documentation that focuses on individual datasets is insufficient – most value comes from combining datasets and nuances around this are often not captured. Whilst invaluable insight from networking with individuals already involved in the OS energy analytics space can be gained, developers should dedicate time to documenting their newly gained knowledge for others following in their footsteps. Skills required to productionise solutions, as well as resourcing for ongoing support and maintenance of OS projects, need to be considered: they represent a risk to the long-term success of developed open-source solutions.  
    Read more...
    Dip into this series of industry blogs sent to us by Bentley Systems. 
    Vertical Buildings: What Asset Owners and Contractors Need to Know about Britain’s New Building Safety Regulator
    Analysis of the U.K.’s Top 100 Construction Companies Shows Which Firms Performed Best Over the Past Decade
    Grand Paris Express: What We Learn from City Centre Transport Megaprojects in Paris and London
    A Smarter Way to Future-proof Our Water Supply
    The Wind of Change Is Blowing on Renewables, Making Them Cheaper and More Efficient, with the U.K. Ideally Placed to Benefit
    A Bird’s Eye View: How the World’s First Digital Twin of a Nation Can Help Create Better Cities
    The Nine Euro Ticket
    Leadership in a Data-driven Age: Why the Best Managers Will Always Welcome Greater Transparency and Why Fundamental Leadership Components Haven’t Changed
    For Electric Vehicle Charging, “Going Dutch” Means Being Open, Transparent, and Interoperable
    Since the Census Helps Plan Infrastructure and Housing, Could a National Framework for Data Help Overcome the Shortcomings of the COVID-19 Census?
    Regardless of Progress at COP27, We Are Getting on with Transforming and Decarbonising Infrastructure Delivery
     
    Do you have any material that would be of interest to our members? Please get in touch - contact me via DT Hub Messages.
     
    Read more...
    Contributors – Leigh Taylor, Garie Warne 
    The digital twin landscape has been revolutionized by the integration of control and automation technologies. These technologies play a crucial role in optimizing operations and maintenance for various industrial and infrastructure systems. The integration of these technologies into the digital twin landscape has enabled organizations to make informed decisions and improve the overall performance of their systems. In this article, we will discuss the Anglian Water OT (Operational Technology) strategy, how critical this is to a successful digital transformation and how it fits into the enterprise picture. Additionally, we will also discuss how a NRTM (Near Real Time Model) solution is being used within the delivery of Anglian Water’s Strategic Pipeline as a "system of systems" to aid operations and maintenance. 
    AW OT Strategy  
     
    The Anglian Water OT strategy is a highly important aspect of the digital twin landscape as it helps describe how these control systems should be implemented and used. It focuses on the use of control and automation technologies to optimize the performance of operational systems. The OT strategy is implemented by using various control and automation technologies, such as Industrial Internet of Things (IIoT) enabled SCADA systems linking into an Industry 4.0 approach with a central data core.  This approach takes the principles of Edge Driven (to ensure that the most up to date information can be used), Report by Exception (to minimise data transfer) and Open Architecture (to avoid vendor lock in). A further principle of Connect, Collect and Store, means that all data is enabled within a connection (to enable ease of future enhancements), what is needed to be looked at is physically collected and looked at, and only what is needed from a latest data update, trend analysis, or historical perspective is stored on a long-term basis. 


    Industry 4.0 
    The Industry 4.0 approach taken by Anglin Water’s Strategic Pipeline Alliance (SPA) differs from previous approaches in that data is placed at the core of the operations and silos, and point-to-point integration are removed. This allows data to be captured at the site (or edge) level and seamlessly be used throughout the enterprise. 
    SCADA systems are used to remotely monitor and control various aspects of industrial and infrastructure systems, such as pipelines, and water treatment facilities. In the digital twin landscape, SCADA systems are used to monitor the performance of infrastructure systems and make adjustments as needed to optimize their performance. For example, Anglian Water is using SCADA systems to monitor the flow of water through the Strategic Pipeline, as well as the functioning of pumps, valves, and other critical components. The SCADA and related control system is made up of several different components, including sensors and actuators that are placed along the pipeline to collect data, and a central control system that processes and displays this data in real-time, all of which must be fully compliant with National Infrastructure Standards (NIS) which governs infrastructure-based systems which are deemed to be critical national infrastructure. 
    SPA recognised that a key component in managing large infrastructure systems is the use of a "data core". A data core is a centralized repository for storing, processing, and analysing data from the pipeline and other systems. This data can include things like sensor data, control system data, and other operational data, as well as more IT centric data such as asset information, location data, hydraulic models, and BIM (Buildings Information Management) data.  
    By storing this data in a centralized location, Anglian Water can easily access and analyse it to identify any issues that need to be addressed. Our Data Core solution involves the use of a centralized data storage and processing system, which is integrated with the SCADA system and other technology systems to provide a holistic view of the pipeline and its surrounding infrastructure. This is a key difference between our approach and many other Proof of Concept activities within the market, as it is inherently scalable and able to more easily be productionised. 
    The implementation of the data core solution also provides opportunities for the development of a "Near Real Time Model" (NRTM) solution for SPA. An NRTM solution will allow Anglian Water to see how the pipeline is behaving in real-time and adjust as needed. By having this level of control, Anglian Water can ensure that the pipeline is operating at peak efficiency and minimize the risk of downtime or other issues. 
    SCADA Control 
     

    Control and automation technologies will be used within SPA to remotely monitor and control various aspects of industrial and infrastructure systems. From a control perspective to ensure the operation of what is a critical asset for supplying water to hundreds of thousands of customers, SPA has a three-layer approach to control, as seen in this diagram. The core layer (Pipeline and Sites) is based upon autonomous control of each individual site, with a further “last line of defence” of manual site-based control.  These are fully isolated from the outside world; however, as the SPA pipeline is highly complex, neither of these is a sustainable position to be in for long. 
    To automate and ensure that all of the 70+ sites that are linked to the SPA pipeline can operate effectively as a single system a SCADA (Supervisory Control and Data Acquisition) system acts as a Regional Control system over all the sites, ensuring that the right amount of wholesome water is received by the right customers at the right time primarily using a mass balance approach to ensuring that water is moved in a way that maximises supply against an agreed prioritisation. 
    Whilst this control system can ensure that the right amount of water is moved, it cannot optimise for cost, impacts related to the use of sustainable energy or other factors such as ensuring we optimise the amount of water we abstract, out of the ground over a yearly period. This is the job of a Near Real Time Model, which will try an optimise as much as possible these factors, making the SPA pipeline as efficient as possible. 
    NRTM Control 
    The NRTM solution is a "system of systems", as it integrates with multiple technology systems to provide a holistic view of the SPA pipeline and its surroundings. This integration allows Anglian Water to make informed decisions based on the data collected from multiple sources. The NRTM solution also allows for predictive maintenance, which is used to identify potential issues before they occur. Predictive maintenance will help Anglian Water to prevent downtime and minimize the need for costly repairs. In addition, the NRTM solution can also provide insights into the energy efficiency of the SPA pipeline, helping to reduce energy costs and improve the overall performance of the system.  
    Summary 
    In conclusion, the digital twin landscape is revolutionizing the way Anglian Water monitors and controls their infrastructure-based systems. The integration of control and automation technologies, the implementation of an OT strategy, and the use of a NRTM solution, are all critical components in the optimization of operations and maintenance. By using these technologies, Anglian Water can make informed decisions, improve the overall performance of their Strategic Pipeline system, and reduce downtime and costs. The digital twin landscape therefore provides a comprehensive and integrated view of complex water systems, allowing Anglian Water to manage their infrastructure more efficiently and effectively. 
    Read more...
    Whilst writing another article about loosely coupled systems and their data, I was struck by one internal reviewer’s comments about one uncontentious (at least to me) statement I made:
    The loosely coupled systems article was already getting a bit long, so I couldn’t go into any depth there. The loose end of the idea was still dangling, waiting for me to pull on it. So I pulled and… well, here we are in another article.
    I’ve always liked origins. I love it when someone crystallises an idea in a “Eureka!” moment, especially if, at the time they have the idea, they have no clue on the wide ranging impact their idea will have. Think Darwin’s “On the Origin of Species”, Mary Wollstonecraft’s “A Vindication of the Rights of Woman” (1792). A particular favourite of mine is the “Planck Postulate” (1900) which led to quantum mechanics.
    The origin story that’s relevant to all this is Tim Berners-Lee’s (TBL) “Vague but exciting…” diagram (1989) which was the origin of the world-wide web. I want you to take another look at it. (Or, if it’s your first look, be prepared to be awed about how much influence that sketch has had on humanity). There are a few things in that diagram that I want to highlight as important to this article:
    Information management Distributed systems Directed graphs …but don’t worry, we’re not going to get into the weeds just yet. 
    I want to introduce a use case and our main character. He’s not real, he’s an archetype. Let’s call him “Geoff”. Geoff is an example of a person in a vulnerable situation. Someone who could benefit from the Priority Service Register (PSR). Geoff lives alone and has the classic three health problems that affect our increasing ageing population: Chronic obstructive pulmonary disease (COPD), Type-2 Diabetes and Dementia.
    Geoff’s known to a lot of agencies. The Health Service have records about him, as do the Police, Utilities (Gas, Water, Electricity), The Post Office, Local Government and, as he has dementia, his local Supermarket. They have a collective responsibility to ensure Geoff has a healthy and fulfilling life. To execute on that responsibility it’s going to mean sharing data about him.
    Now we’re set in the arc of our story. We’ve got the four characteristics of these kind of problems:
    Heterogeneous data Diverse ownership Selfish agendas Overarching cooperative goal To expand: Data about Geoff is in various databases in different forms owned by assorted agencies. Each of those agencies has its own classifications for vulnerabilities, goals, aims and agenda - targets and KPIs to which they have to adhere - but remember they also have a joint responsibility to make sure Geoff is ok.
    In this article, I’d like to weave the three aspects of TBL’s diagram with the four characteristics of the problem space and see if we can “Solve for Geoff” and improve his experience.
    Let’s start with information management in distributed systems. The understanding of  “Distributed Systems” has moved on since 1989. What we’re talking about here is a “Decentralised” system. There’s not one place (in the centre) where we can put data about Geoff. Everyone has some information about him and we need to manage and share that information for the good of Geoff.
    If we imagine a couple of separate relational databases that have rows of data about Geoff, we’ll see there are two problems.
    Two different versions of Geoff Spotted them? They are:
    The names of the columns are different The identifying “key” data isn’t the same (Why would they be? They’re in different systems) To generalise: 1. is about metadata - the data about the data; 2. Is about identity.
    So, to metadata. In a relational database there is some metadata, but not much, and it’s pretty hidden. You’ve probably heard of SQL, but not of SQL’s cousin, DDL (data definition language). DDL is what defines the tables and their structure so the first example above would be something like:
    Data Definition Language for the Persons table What’s wrong with this? (I hear you ask). At least a couple of things. One is that there’s no description of what the terms mean. What does “Vulnerable” mean? And by defining it as a boolean, you’re either vulnerable or not. The other thing that’s very important in Geoff’s scenario is that this (incomplete and unhelpful) metadata is never exposed. You might get a CSV file with the column headings, and a word document explaining what they mean to humans, but that’s about it. Good luck trying to get a computer to understand that autonomously...
    A part of Tim Berners-Lee's "Vague but exciting" diagram I haven’t forgotten TBL’s diagram. In it, he hints at another way of describing data: using a directed graph. A graph has nodes (the trapeziums in his diagram) and edges (the lines with words on them). The directed bit is that they’re arrows, not just lines. He’s saying that there are a couple of entities: This Document and Tim Berners-Lee and that the entity called Tim Berners-Lee wrote the entity called This Document. (And, as it’s directed, The Document didn’t, and couldn’t, write Tim Berners-Lee.)
    Skipping forward blithely over many developments in computer science, we arrive at the Resource Description Framework (RDF) which is a mechanism for expressing these graphs in a machine-readable way. RDF is made of individual “Triples”, each one of which asserts a single truth. The triple refers to the three parts: subject, predicate and object (SPO). To paraphrase, the above bit of graph would be written:
    Subject                       Predicate      Object
    Tim Berners-Lee      Wrote            This document
    We can translate Geoff’s data into RDF, too. The following is expressed in the “Terse Triple Language” (TTL or “Turtle”) which is a nice compromise between human and machine readability.
    RDF version of Geoff's data The things before the colons in the triples are called “prefixes” and, together with the bit after, they’re a shorthand way to refer to the definition of the property (like fibo:hasDateOfBirth) or class (like foaf:Person). Notice that I’ve hyperlinked the definitions. This is because all terms used in RDF should be uniquely referenceable (by a URL) somewhere in an ontology. Go on, click the links to see what I mean.
    We’ve now bumped into one of the ideas that spun out of TBL’s first diagram: the Semantic Web. He went on (with two others) to describe it further in their seminal paper of 2001. All the signs were there in that first diagram, as we’ve just seen. Since then, the Semantic Web has been codified in a number standards, like RDF, with a query language, SPARQL, and myriad ontologies spanning multiple disciplines and domains of knowledge. The Semantic Web is often connected to the concept of “Linked Data”, in that you don’t have to possess the data: You can put a link to it in your data and let the WWW sort it out. foaf:Person from above is a small example of Linked Data - they’ve defined “Person” in a linkable way so I can use their definition by adding a link to it. We’ll get back to this in a bit.
    There are so many great reasons for encoding data in RDF. Interoperability being the greatest, in my opinion. I can send that chunk of RDF above to anybody and they (and their computers) should be able to understand it unambiguously as it’s completely self-contained and self-describing (via the links). 
    There’s just not an equivalent in relational or other databases:
    That’s dealt with the first of our two problems outlined before, i.e. metadata. Let’s move on to identity. In my (and a lot of people’s) opinion identity wasn’t really considered carefully enough at the beginning of the internet. I don’t blame them. It would have been hard to predict phishing, fake accounts and identity theft back in 1989.
    I put <some_abstract_id> in the RDF example, above, on purpose. Mainly because RDF needs a “subject” for all the triples to refer to, but also because I wanted to discuss how hard it is to think of what that id/subject would be. In RDF terms it should be a IRI as it should point to a uniquely identifiable thing on the Internet, but what should we use? I have quite a lot of identities on the internet. On LinkedIn, I’m https://www.linkedin.com/in/mnjwharton/ . On Twitter, I’m https://twitter.com/iotics_mark . In Geoff’s case, what identity should we use? He has two in my contrived example: “1234” and “4321” - neither of which have any meaning outside the context of their respective databases. I certainly can’t use them as my <some_abstract_id> as they’re not URLs or URIs.
    To solve this problem, who we gonna call? Not Ghostbusters, but the W3C and their Decentralised Identifiers (DIDs). Caveat first. This isn’t the only way to solve identity problems, just my favourite. The first thing to know about DIDs is that they are self-sovereign. This is important in a decentralised environment like the internet. There is (rightly) no place I can go to set up my “internet id”. I can set up my own id, host it anywhere on the internet and, when it’s resolved (looked up in a database, for example), it will show you a short document. Here’s an example from the W3C spec - first the DID itself:
    did:example:123456789abcdefghi
    And then the document to which it points
    Example DID document I agree that it looks pretty complicated, but it isn’t really for regular humans. The important thing is that I can prove, cryptographically, that this id is mine as it has my public key and I can add proofs to it that only I can make (because only I have my private key). (Note for tech nerds. The document is in JSON-LD - the JSON serialisation of RDF). These documents are stored in a Registry (which in itself should be decentralised, such as a blockchain or a decentralised file system such as IPFS).
    Let’s get back to Geoff. The <some_abstract_id> I put in earlier, can now be replaced by Geoff’s. I’ll make one up for him
    did:madeup:9e0ff
     Then we can use an excellently-named technique called Identity “smooshing” i.e. we can link all the other identities of Geoff that we know about using some triples. There are various we could pick.
    foaf:nick - someone’s nickname
    skos:altLabel - an alternative label for something
    But I think that gist:isIdentifiedBy from the Semantic Arts’ Gist ontology is the best idea for Geoff.  gist:isIdentifiedBy describes itself as:
    Perfect! Especially the bit about being able to have more than one.
    Putting all the bits together, using decentralised identifiers, semantics and linked data we can have the self-sovereign id for Geoff linked to all his data and the other identifiers in other systems - all in one place and all self-contained and self-describing
    Full RDF version of Geoff with links to other systems information Tying all the threads together to conclude. TBL’s vision of the World Wide Web and the Semantic Web were, and remain, decentralised to their core. Clue’s in the name. “Web”. His original diagram had all the pieces (except for Id) - information management in distributed (now decentralised) systems using graphs. TBL even tried to rename the WWW the Giant Global Graph (GGG) to emphasise this. Now most people just bundle these technologies as Web 3.0.
    We also managed to “solve for Geoff” - the diverse, customer-in-a-vulnerable-situation use case - by allowing all the parties to keep data about Geoff:
    In their own systems Using their own identifiers In an interoperable way (i.e. in RDF triples) so they can share some/all of it. I think of this not as a standard as such, but a standard approach. It’s like we all agree about the alphabet to use, but we don’t care so much about what you write using it.
    Decentralised problems call for decentralised solutions and the mix of Semantics and Decentralisation allow everyone to keep control of their data about Geoff and to manage their part of the service mix, but also to share it with others in an interoperable way. At IOTICS, we call it “Digital Cooperation”.
    I don’t really care what you call it, Semantics and Decentralisation go together like Fish and Chips, Beans on Toast, Strawberries and Cream. Strawberries are nice; cream is nice. But, together, they are more than the sum of their parts.
     
     
    Read more...
    Here are a few photos from the live launch of the Apollo Protocol white paper on 25 October.
    The launch also included news of the InnovateUK funded programme of Hacks we are running over the next few months.  Read on for links and more info:

    The team who wrote the white paper: @Su Butcher, @Henry Fenby-Taylor, Adam Young (techUK), @Paul Surin, @Rab Scott, @Neil Thompson, @Jonathan Eyre, @Rick Hartwig. 

    Fergus Harradence (BEIS) endorsing the Apollo Protocol in front of a slide showing the stakeholders.

    John Patsavellas cautioning us about data for the sake of it.

    Richard Robinson describing the Construction Leadership Council's vision for the future and endorsing the Apollo Protocol.

    Austin Cook of BAE Systems gave a fascinating insight into the limitations even such an advanced manufacturer is grappling with, and describing their Factory of The Future project.

    A ripple of amusement runs through the audience when Miranda Sharp mentions that "everyone thinks we should share data but not their particular data at this particular time".

    @David Wagg has just been appointed one of the leads on the infrastructure arm of the pan-UK Turing Research and Innovation Cluster.

    @Jonathan Eyre and @Neil Thompson announce the InnovateUK funded Hack sessions. Read more about the first ones and sign up here: https://engx.theiet.org/b/blogs/posts/digital-twins-apollo-protocol-value-hack

    Maria Shiao asks a question from the floor.

    Chair @Rab Scott kept us entertained!

    Post event drinks and networking
    Want to watch the live launch? You can do so here: 
    Want to come to the Hacks? Find out more here: https://engx.theiet.org/b/blogs/posts/digital-twins-apollo-protocol-value-hack
    Want to keep in touch? Join the Apollo Protocol Network here: 


    Read more...
    100%Open is working with a Net Zero Buildings (domestic & non-domestic sites) accelerator to research the key brands and the propositions working in this area.
    If you work in a closely related industry with responsibility for decarbonisation, renewables, energy efficiency and/or net zero buildings’ design, management, products and services and would like to take part in this research, we would love to have you take part and can offer £50 in acknowledgment for the needed time investment of a 45 minute interview this November, 2022. 
    There is a limited time on this offer, so if you or anyone you know is interested, send us an email to hello@100open.com today!
    Read more...
    The department of Computer Science in Innsbruck (Austria) is currently working togehter with the Aston University in the UK. Togehter they elaborated a really interesting survey in the field of DIGITAL TWINS. The underlying question is to what extent companies recognise or have already recognised the potential of digital twins for themselves and are therefore already working with them. This may be the case in product development, but can also have other aspects, e.g. a smart shop floor, virtual factory, etc.
    Be part of it and help shaping future reseach agendas in digital twin engineering.
    It won't take long and it is completely anonymously.
    https://umfrage.uibk.ac.at/limesurvey/allgemein/index.php/273288?lang=en
     
     
    Read more...
    Contribution of SPA to the Anglian Water's digital twin roadmap 
    Anglian Water has a 15-year roadmap for achieving an enterprise-wide Digital Twin that can ultimately form part of the long-term vision for a UK National Digital Twin.  
     
    The very first steps of the roadmap, which defined how Anglian Water's digital twin can meet the regulated outcomes as prescribed by Ofwat, are complete.  Those activities were followed by a proof of concept that showed how digital twin approaches could improve energy management and workforce efficiency within the example context of a pumping station. 
    SPA is now at the next stage of the roadmap, where we have rolled out a first version of our applications and data architecture.  Our focus and biggest challenge are building an extendable platform that can support the future Anglian Water's Digital Twin ambitions, whilst value is driven for SPA in the short term. 
    Implementing our applications and data strategy is a substantial transformational change, which requires a cultural shift towards a product approach, and a concerted effort to align the architecture across people, culture, technology, and data.
    Product approach  
    Anglian Water has been investigating the merits of product lifecycle management approaches to introduce a 'product mindset' to the business, ensuring that investments promote repeatability and robust standards.  
    In this context, SPA has been working with Anglian Water to develop an asset information model, process blocks and product data templates. Those elements provide the foundation for a product-based approach around digital assets that can be reused across the AW enterprise.  
     
    SPA has also developed various graphical interfaces through BIM, GIS and control and automation platforms, which have provided a mechanism to build products to allow user interaction with the digital assets. These graphical interfaces provide the stakeholders with powerful ways of asking "what if" questions facing different organisation objectives and asset functions. 
     
    Application architecture
    SPA acts as a 'critical friend' to the Anglian Water enterprise. All SPA applications are continuously assessed regarding extendibility and compatibility within the Anglian Water applications landscape.  
    That said, SPA strives to use technologies recently approved or historically used by Anglian Water. That approach brings significant benefits in reducing procurement costs and ensuring continuity.  
    On the other hand, the focus on a conscious coupling of delivery and the longer-term roadmap for Anglian Water does mean that there is initially a greater level of complexity. However, that approach is already showing benefits in the velocity of our trajectory with the ability to reuse existing patterns and gain consensus and goodwill amongst the wider change community.
    Data architecture
    From a data perspective Anglian Water, with its strong Digital Twin ambitions, is in the process of maturing the curation and management of data. That involves activities in several areas such as data accuracy, integrity, completeness and timeliness. We are working with our Anglian Water colleagues to enable these through: 
    Aligning our data templates with key Anglian Water contextual data, such as Asset identification, Asset location and functional location codes. That is to ensure data continuity within the various systems through using the same identification system as the one that Anglian Water has developed.  Highlighting where current technologies cannot securely and safely house the core data required for the Digital Twin.  Ensuring that data can flow from systems of record, and sensors, into the Digital Twin in a manner that enables timely decisions to be made.  Ensuring that data captured within the SPA design and build phases can be held within the Anglian Water IT systems post-handover.  People and culture
    There persists a view that technology such as digital twins will drive new value on their own. We believe however that value will be realised from business transformation enabled by digital twins. This will require a cultural shift in a very traditional industry.  
    The Strategic Pipeline Alliance was built on the principles of enabling data-informed decision-making. Valuing "data as an asset" is a new concept for Anglian Water.  
    Although there are robust governance processes within the organisation, an approach of open early communication has been taken to provide a "no surprises" philosophy. That approach ensures appropriate stakeholders are engaged as soon as is practical after identification and brought into the philosophy of our journey. 
    Education and storytelling are fundamental to help guide and draw the Anglian Water organisation along this transformational journey. Therefore, we are working closely with Anglian Water communities of practice to understand the required business capabilities and the current maturity of the Anglian Water organisation in these areas. For example, the Anglian Water and SPA architecture share a leading-edge enterprise architecture model, to ensure consistency and a frictionless handover. 
    A 'core delivery team' has been formed to work with SPA and Anglian Water stakeholders. The team ensures alignment from both a technical and cultural perspective, supporting the development of digital assets. Subject matter experts support the core team and are brought in as required to help deliver specialist services, such as penetration testing, installation of sensors and Operational Technology, or creation of data driven hydraulic models. 
       
    What is certainly clear is that we still have a lot to learn, however by following good architectural best practice and placing people at the heart of everything we do, we have put in place a good foundation from which to build. 
    If you would like to know more, please get in touch through the DT Hub.


    Read more...
    Join us to celebrate the launch of the Infrastructure Client Group Annual Digital Benchmarking Report 2021 on 15 June 2022 at 9:00 BST by REGISTERING HERE.
    The ICG Report, powered by the Smart Infrastructure Index, surveys asset owners and operators who jointly represent over £385bn worth of capital assets and over 40% of the national infrastructure and construction pipeline.
    After Mark Enzer, former Head of the National Digital Twin Programme, Centre for Digital Built Britain, introduces the report, Andy Moulds and Anna Bowskill, Mott MacDonald, will uncover the results of the latest research into the state of the nation for digital adoption and maturity.
    This will be followed by a panel of industry thoughts leaders and practitioners, chaired by Melissa Zanocco, Co-Chair DTHub Community Council, sharing their views and best practice case studies from the ICG Digital Transformation Task Group and Project 13 Adopters including:
    Karen Alford, Environment Agency – skills Matt Edwards, Anglian Water – digital twins Sarah Hayes, CReDo – Climate Resilience Demonstrator digital twin Neil Picthall, Sellafield – common data environments Matt Webb, UK Power Networks – digital operating models Will Varah, Infrastructure & Projects Authority – Transforming Infrastructure Performance: Roadmap to 2030 REGISTER to find out how much progress has been made at a time when digital transformation is a critical enabler for solving the global, systemic challenges facing the planet.
    For any questions or issues, please contact Melissa Zanocco: melissa.zanocco@ice.org.uk 
    Please note: We plan to make a recording of the event available. Please note that third parties, including other delegates may also take pictures or record videos and audio and process the same in a variety of ways, including by posting content across the web and social media platforms.
    Read more...
    The bigger and more complicated the engineering problem, the more likely it is to have a digital twin. Firms that build rockets, planes and ships, for example, have been creating digital twins since the early 2000s, seeing significant operational efficiencies and cost-savings as a result. To date, however, few firms have been able to realise the full potential of this technology by using it to develop new value- added services for their customers. We have developed a framework designed to help scale the value of digital twins beyond operational efficiency towards new revenue streams.
    In spite of the hype surrounding digital twins, there is little guidance for executives to help them make sense of the business opportunities the technology presents, beyond cost savings and operational efficiencies. Many businesses are keen to get a greater return on their digital twins’ investment by capitalising on the innovation – and revenue generating - opportunities that may arise from a deeper understanding of how customers use their products. However, because very few firms are making significant progress in this regard, there is no blueprint to follow. New business models are evolving but the business opportunities for suppliers, technology partners and end-users is yet to be fully documented.
    Most businesses will be familiar with the business model canvas as a tool to identify current and future business model opportunities. Our ‘Four Values’ (4Vs) framework for digital twins is a more concise version of the tool, developed to help executives better understand potential new business models. It was designed from a literature review and validated and modified through industry interviews. The 4Vs framework covers: the value proposition for the product or service being offered, the value architecture or the infrastructure that the firm creates and maintains in order to generate sustainable revenues; the value network representing the firm’s infrastructure and network of partners needed to create value and to maintain good customer relationships; and value finance such as cost and revenue structures.
    Value proposition
    The value proposition describes how an organisation creates value for itself, its customers and other stakeholders such as supply chain partners. It defines the products and services offered, customer value (both for customers and other businesses) as well as the ownership structure. Examples of digital twin-based services include condition monitoring, visualization, analytics, data selling, training, data aggregation and lifespan extension. Examples of customer value in this context might include: decision support, personalisation, process optimisation and transparency, customer/operator experience and training.
    Value architecture
    The value architecture describes how the business model is structured. It has 5 elements: 1. Value control is the approach an organisation takes to control value in the ecosystem. For example, does it exist solely within its own ecosystem of digital twin services or does it intersect with other ecosystems? 2. Value delivery describes how the digital twins are delivered, are they centralised, decentralised or hybrid? It also seeks to understand any barriers that may prevent the delivery of digital twins to customers. 3. Interactions refers to the method of customer interaction with the digital twin. Common examples of interaction include desktop or mobile app, virtual reality and augmented reality interactions. 4. Data collection underlies the digital twin value proposition and can be a combination of the following: sensor based and/or supplied/purchased data. 5. Boundary resources are the resources made available to enhance network effects and scale of digital twin services. This typically comprises of the following: APIs, hackathons, software development toolkits and forums.
    Value network
    The value network is the understanding of interorganisational connections and collaborations between a network of parties, organisations and stakeholders. In the context of digital twin services, this is a given as the delivery mechanism relies on multiple organisations, technological infrastructure and stakeholders.
    Value finance
    This defines how organisations approach costing, pricing methods and revenue structure for digital twins. Digital twin revenue model most commonly refers to outcomes-based revenue streams and data-driven revenue models. Digital twin pricing models include, for example, freemium and premium, subscription models, value-based pricing and outcome-based pricing models. Four types of digital twin business models were identified from extensive interviews with middle and top management on services offered by digital twins, we identified four different types of business models and applied our 4Vs approach to understand how those models are configured and how they generate value.
    Brokers
    These were all found in information, data and system services industries. Their value proposition is to provide a data marketplace that orchestrates the different players in the ecosystem and provides anonymised performance data from, for example, vehicle engines or heating systems for buildings. Value Finance consists of recurring monthly revenues levied through a platform which itself takes a fee and allocates the rest according to the partnership arrangements.
    Maintenance-optimisers
    This business model is prevalent in the world of complex assets, such as chemical processing plants and buildings. Its value proposition lies in providing additional insights to the customer on the maintenance of their assets to provide just-in-time services. What-if analysis and scenario planning are used to augment the services provided with the physical asset that is sold. Its Value Architecture is both open and closed, as these firms play in ecosystems but also create their own. They control the supply chain, how they design the asset, how they test it and deliver it. Its Value Network consists of strategic partners in process modelling, 3D visualisation, CAD, infrastructure and telecommunications. Value Finance includes software and services which provide a good margin within a subscription model. Clients are more likely to take add-on services that show significant cost savings.
    Uptime assurers
    This business model tends to be found in the transport sector, where it’s important to maximise the uptime of the aircraft, train or vehicle. The value proposition centres on keeping these vehicles operational, either through predictive maintenance for vehicle/ aircraft fleet management and, in the case of HGVs, route optimisation. Its Value Architecture is transitioning from closed to open ecosystems. There are fewer lock- in solutions as customers increasingly want an ecosystems approach. Typically, it is distributors, head offices and workshops that interact with the digital twin rather than the end-customer. The Value Network is open at the design and assembly lifecycle stages but becomes closed during sustainment phases. For direct customers digital twins are built in-house and are therefore less reliant on third-party solutions. Its Value Finance is focused on customers paying a fee to maximise the uptime of the vehicle or aircraft, guaranteeing, for example, access five days a week between certain hours.
    Mission assurers
    This business model focuses on delivering the necessary outcome to the customers. It tends to be found with government clients in the defense and aerospace sector. Value propositions are centered around improving efficacy of support and maintenance/ operator insight and guaranteeing mission success or completion. These business models suffer from a complex landscape of ownership for integrators of systems as much of the data does not make it to sustainment stages. Its Value Architecture is designed to deliver a series of digital threads in a decentralised manner. Immersive technologies are used for training purposes or improved operator experience. Its Value Network is more closed than open as these industries focus on critical missions of highly secure assets. Therefore, service providers are more security minded and careful of relying on third-party platforms for digital twin services. Semi-open architecture is used to connect to different hierarchies of digital twins/digital threads. Value Finance revealed that existing pricing models, contracts and commercial models are not yet necessarily mature enough to transition into platform-based revenue models. Insights as a service is a future direction but challenging at the moment, with the market not yet mature for outcome-based pricing.
    For B2B service-providers who are looking to generate new revenue from their digital twins, it is important to consider how the business model should be configured and identify major barriers to their success. Our research found that the barriers most often cited were cost, cybersecurity, cultural acceptance of the technology, commercial or market needs and, perhaps most significantly, a lack of buy-in from business leaders. Our 4Vs framework has been designed to help those leaders arrive at a better understanding of the business opportunities digital twin services can provide. We hope this will drive innovation and help digital twins realise their full business potential.
    Now for a small request to the reader that has reached this far, we are looking to scale these research findings in our mass survey across industry on the business models of digital twins. If your organisation is planning to implement or has already started its journey of transformation with digital twins please help support our study by participating in our survey. Survey remains fully anonymised and all our findings will be shared with the DTHub community in an executive summary by the end of the year.
    Link to participate in the survey study https://cambridge.eu.qualtrics.com/jfe/form/SV_0PXRkrDsXwtCnXg 
    Read more...
    Transforming an entire industry is, at its core, a call to action for all industry stakeholders to collaborate and change. The National Digital Twin programme (NDTp) aims to do just that, enabling a national, sector-spanning ecosystem of connected digital twins to support people, the economy, and the natural environment for generations to come. 
    But to achieve these ambitious impacts, a great deal of change needs to occur. So, to provide clear rationale for why potential activities or interventions should be undertaken and why they are expected to work, Mott MacDonald has worked with CDBB to develop a Theory of Change (ToC) and a Benefits Realisation Framework (BRF) to represent the logical flow from change instigators (i.e., levers) to overall benefits and impacts. The ToC and BRF are expected to provide future leaders and policymakers with a clear understanding of the drivers of change and the actors involved to create an ecosystem of connected digital twins. 
     
    Components of the Theory of Change 
    Within the ToC, we outline several key components - actors, levers, outputs, outcomes, impacts, and interconnected enablers. As a national programme uniting the built environment through a complex system of systems, it is essential that multiple actors collaborate, including asset owners and operators, businesses, government, academia, regulators, financial entities, and civil society. These actors need to share a common determination to move the needle towards better information management by utilising a combination of interconnected levers to kickstart the change: financial incentives, mandates and legislation as well as innovation.  
    We see that pulling these three levers is likely to trigger tangible change pathways (i.e., the routes in which change takes place), manifested through the ToC outputs and intermediate outcomes, leading to the creation of institutional and behavioural changes, including organisations taking steps to improve their information management maturity and exploring cross-sector, connected digital twins. Ultimately, we consider these change pathways to lead to the long-term intended impact of the NDTp, achieving benefits for society, the economy, businesses, and the environment. 
    Underpinning and supporting the levers and change pathways are the enablers. We see these as positive market conditions or initiatives and are key in implementing and accelerating the change. They span having a unifying NDTp strategy, vision and roadmap, empowering leadership and governance, leveraging communication and communities, building industry capacity, and adopting a socio-technical approach to change.  
     
    The five levels of the Theory of Change 
    We intend for the ToC to outline how change can occur over five distinct levels: individual, organisational, sectoral, national, and international. The individual level involves training and upskilling of individuals from school students to experienced professionals, so that individuals can be active in organisations to drive and own the change. Our previous work with CDBB focused on the Skills and Competency Framework to raise awareness of the skills and roles needed to deliver a National Digital Twin in alignment with the Information Management Framework (IMF). 
    At the core of establishing the National Digital Twin is the organisational level, within which it is essential for change to occur so that organisations understand the value of information management and begin to enhance business processes. Broadening out from these two levels sits the sectoral level, where the development of better policies, regulations and governance can further support the change across all levels. Similarly, change at the national level will guide strategic engagement and should encourage further public support. 
    Ultimately, change at these four levels should achieve change at an international level, where the full potential of connected digital twins can be realised. Through the encouragement of international knowledge sharing and by creating interconnected ecosystems, challenges that exist on a global scale such as climate change can be tackled together. 
     
    Benefits Realisation Framework 
    Monitoring and evaluation have been fundamental to the assessment of public sector policy and programme interventions for many years. The potential benefits of the NDTp are significant and far reaching, and we have also developed guidance on how to establish a benefits realisation framework, based on UK best practice including HM Treasury’s Magenta Book, to drive the effective monitoring and evaluation of NDTp benefits across society, the economy, businesses, and the environment. We intend for this to provide high-level guidance to measure and report programme benefits (i.e., results) and track programme progress to the NDTp objectives outlined in the Theory of Change. 
     
    The Gemini Papers 
    Our work in developing the Theory of Change for the National Digital Twin programme has informed one of the recently published Gemini Papers. The Gemini Papers comprise three papers addressing what connected digital twins are, why they are needed, and how to enable an ecosystem of connected digital twins, within which the Theory of Change sits.
    Together, we can facilitate the change required to build resilience, break down sectoral silos and create better outcomes for all. 
     
    Read more...
    Several Terms such as Digital Ecosystem, Digital Life, Digital World, Digital Earth have been used to describe the growth in technology. Digital twins are contributing to this progress, and it will play a major role in the coming decades. More digital creatures will be added to our environments to ease our life and to reduce harms and dangerous. But can we trust those things? Please join the Gemini call on the 29th of March; Reliability ontology was developed to model hardware faults, software errors, autonomy/operation mistakes, and inaccuracy in control. These different types of problems are mapped into different failure modes. The purpose of the reliability ontology is to predict, detect, and diagnose problems, then make  recommendations or give some explanations to the human-in-the-loop. I will discuss about these topics and will describe how ontology and digital twins are used as a tool to increase the trust in robots. 
    Trust in the reliability and resilience of autonomous systems is paramount to their continued growth, as well as their safe and effective utilisation.    A recent global review into aviation regulation for BVLOS (Beyond Visual Line of Sight) with UAVs (Unmanned Aerial Vehicles) by the United States Congressional Research Office, highlighted that run-time safety and reliability is a key obstacle in BVLOS missions in all of the twelve European Union countries reviewed . A more recent study also highlighted that within a survey of 1500 commercial UAV operators better solutions towards reliability and certification remain a priority within unmanned aerial systems. Within the aviation and automotive markets there has been significant investment in diagnostics and prognostics for intelligent health management to support improvements in safety and enabling capability for autonomous functions e.g. autopilots, engine health management etc.
    The safety record in aviation has significantly improved over the last two decades thanks to advancements in the health management of these critical systems.     In comparison, although the automotive sector has decades of data from design, road testing and commercial usage of their products they still have not addressed significant safety concerns after an investment of over $100 Billion in autonomous vehicle research.  Autonomous robotics face similar, and also distinct, challenges to these sectors. For example, there is a significant market for deploying robots into harsh and dynamic environments e.g. subsea, nuclear, space etc which present significant risks along with the added complexity of more typical commercial and operational constraints in terms of cost, power, communication etc which also apply. In comparison, traditional commercial electronic products in the EEA (European Economic Area) have a CE marking, Conformité Européenne, a certification mark that indicates conformity with health, safety, and environmental protection standards for products sold within the EEA. At present, there is no similar means of certification for autonomous systems.    
    Due to this need, standards are being created to support the future requirements of verification and validation of robotic systems. For example, the BSI standards committee on Robots and Robotic Devices and IEEE Global Initiative for Ethical Considerations in Artificial Intelligence and Autonomous Systems (including P7009 standard) are being developed to support safety and trust in robotic systems. However, autonomous systems require a new form of certification due to their independent operation in dynamic environments. This is vital to ensure successful and safe interactions with people, infrastructure and other systems. In a perfect world, industrial robotics would be all-knowing.  With sensors, communication systems and computing power the robot could predict every hazard and avoid all risks. However, until a wholly omniscient autonomous platform is a reality, there will be one burning question for autonomous system developers, regulators and the public - How safe is safe enough? Certification infers that a product or system complies with legal relevant regulations which might slightly differ in nature from technical or scientific testing. The former would involve external review, typically carried out by some regulators to provide guidance on the proving of compliance, while the latter usually refers to the reliability of the system. Once a system is certified, it does not guarantee it is safe – it just guarantees that, legally, it can be considered “safe enough” and that the risk is considered acceptable.
    There are many standards that might be deemed relevant by regulators for robotics systems. From general safety standards, such as ISO 61508, through domain specific standards such as ISO 10218 (industrial robots), ISO 15066 (collaborative robots), or RTCA DO-178B/C (aerospace), and even ethical aspects (BS8611).  However, none of those standards address autonomy, particularly full autonomy wherein systems take crucial, often safety critical, decisions on their own. Therefore, based on the aforementioned challenges and state of the art, there is a clear need for advanced data analysis methods and a system level approach that enables self-certification for systems that are autonomous, semi or fully, and encompasses their advanced software and hardware components, and interactions with the surrounding environment.     In the context of certification, there is a technical and regulator need to be able to verify the run-time safety and certification of autonomous systems. To achieve this in dynamic real-time operations we propose an approach utilising a novel modelling paradigm to support run-time diagnosis and prognosis of autonomous systems based on a powerful representational formalism that is extendible to include more semantics to model different components, infrastructure and environmental parameters.
    To evaluate the performance of this approach and the new modelling paradigm we integrated our system with the Robotics Operating System (ROS) running on Husky (a robot platform from Clearpath) and other ROS components such as SLAM (Simultaneous Localization and Mapping) and ROSPlan-PDDL (ROS Planning Domain Definition Language). The system was then demonstrated within an industry informed confined space mission for an offshore substation. In addition, a digital twin was utilized to communicate with the system and to analysis the system’s outcome.
    Read more...
    Intelligent infrastructure is a new trend that aims to create a work of connected physical and digital objects together in industrial domains via a complex digital architecture which utilises different advanced technologies. A core element to this is the intelligent and autonomous component. Two-tiers intelligence is a novel new concept for coupling machine learning algorithms with knowledge bases. The lack of availability of prior knowledge in dynamic scenarios is without doubt a major barrier for scalable machine intelligence. The interaction between the two tiers is based on the concept that when knowledge is not readily available at the top tier, the knowledge base tier, more knowledge cab be extracted from the bottom tier, which has access to trained models from machine learning algorithms.
    It has been reported that the need for intelligent autonomous systems – based on AI and ML – operating in real-world conditions to radically improve their resilience and capability to recover from damage. It has been expressed the view that there is a prospect for AI and ML to solve many of those problems. A claim has been made that a balanced view of intelligent systems by understanding the positive and negative merits will have impact in the way they are deployed, applied, and regulated in real-world environments.  A modelling paradigm for online diagnostics and prognostics for autonomous systems is presented. A model for the autonomous system being diagnosed is designed using a logic-based formalism, the symbolic approach. The model supports the run-time ability to verify that the autonomous system is safe and reliable for operation within a dynamic environment. However, during the work we identified some areas where knowledge for the purpose of safety and reliability is not readily available. This has been a main motive to integrate ML algorithms with the ontology.
    After decades of significant research, two approaches to modelling cognition and intelligence have been investigated and studied: Networks (or Connectionism) and Symbolic Systems. The two approaches attempt to mimic the human brain (neuroscience) and mind (logic, language, and philosophy). While the Connectionism approach considers learning as the main cognitive activity, the Symbolic Systems are broader, they also look at reasoning (for problem solving and decision making) as the main cognitive activity besides learning. Although, learning isn’t the focus of Symbolic Systems, powerful – but limited – methods were applied, such as ID3 (define) and its different variations and versions. Furthermore, the Connectionism approach is concerned with data while Symbolic Systems are concerned with knowledge.
    Psychologists have developed non-computational theories of learning that have been the source of inspiration for both approaches. Psychologists have also differentiated between different types of learning (such as learning from experience, by examples, or a combination of both). In addition, unlike in animals (it is difficult to test intelligence in non-human creatures), human psychologists have also produced methods to test human intelligence. Mathematicians have also contributed statistical methods and probabilistic models to predict behaviour or to rank a trend. The subject of Machine Learning (ML) is the bag for all algorithms used to mine data in the hope that we can learn something useful from the data, which is usually distributed, structured or unstructured, and of significant size.  Although there are several articles on the differences and similarities between Artificial Intelligence and Machine learning, and articles on the importance of the two schools, there are no real or practical attempts that have been reported in the literature to practically use or combine the two approaches together. Therefore, this is an attempt to settle the ongoing conflicts between the two existing thoughts for modelling cognition and intelligence in humans. We argue that two-tiers intelligence is a mandate for machine intelligence as it is the case for human. Animals, on the other hand, have one-tier intelligence, which is the intrinsic and the static know-how. The harmony between the two tiers can be viewed from different angles, however they complement each other, and both are mandatory for human intelligence and hence machine intelligence.
    The lack of availability of prior knowledge in dynamic complex systems of is without doubt a major barrier to scalable machine intelligence. Several advanced technologies are used to control, manipulate, and utilise all parts whether software, hardware, mobile assets such as robots, or even infrastructure assets such as wind turbines. The two-tiers intelligence approach will enhance the learning and knowledge sharing process in a setup that heavily relies on some sort of symbiotic relationships between its parts and the human operator.
    Read more...
    A digital twin is a digital representation of something that exists in the physical world (be it a building, a factory, a power plant, or a city) and, in addition, can be dynamically linked to the real thing through the use of sensors that collect real-time data. This dynamic link to the real thing differentiates digital twins from the digital models created by BIM software—enhancing those models with live operational data.
    Since a digital twin is a dynamic digital reflection of its physical self, it possesses operational and behavioral awareness. This enables the digital twin to be used in countless ways, such as tracking construction progress, monitoring operations, diagnosing problems, simulating performance, and optimizing processes.
    Structured data requirements from the investor are crucial for the development of a digital twin. Currently project teams spend a lot of time putting data into files that unfortunately isn’t useful during the project development or ultimately to the owner; sometimes it is wrong, at other times too little, or in other cases an overload of unnecessary data. At the handover phase, unstructured data can leave owner/operators with siloed data and systems, inaccurate information, and poor insight into the performance of a facility. Data standards such as ISO 19650 directly target this problem that at a simple level require an appreciation of the asset data lifecycle that starts with defining the need in order to allow for correct data preparation.

    Implementing a project CDE helps ensure that the prepared data and information is managed and flows easily between various teams and project phases, through to completion and handover. An integrated connected data environment can subsequently leverage this approved project data alongside other asset information sources to deliver the foundation of a valuable useable digital twin.
    To develop this connected digital twin, investors and their supply chains can appear to be presented with two choices: an off-the-shelf proprietary solution tied to one vendor or the prospect of building a one-off solution with risk of long term support and maintenance challenges. However, this binary perspective is not the case if industry platforms and readily available existing integrations are leveraged to create a flexible custom digital twin.
    Autodesk has provided its customer base with the solutions to develop custom data integrations over many years, commencing with a reliable common data environment solution. Many of these project CDEs have subsequently migrated to become functional and beneficial digital twins because of a structured data foundation. Using industry standards, open APIs and a plethora of partner integrations, Autodesk’s Forge Platform, Construction Cloud and recently Tandem enable customers to build the digital twin they need without fear of near term obsolescence or over commitment to one technology approach. Furthermore partnerships with key technology providers such as ESRI and Archibus extend solution options as well as enhancing long term confidence in any developed digital twin.

    The promises of digital twins are certainly alluring. Data-rich digital twins have the potential to transform asset management and operations, providing owners new insights to inform their decision-making and planning. Although digital twin technologies and industry practice are still in their youth, it is clear that the ultimate success of digital twins relies on connected, common, and structured data sources based on current information management standards, coupled with adoption of flexible technology platforms that permit modification, enhancement or component exchange as the digital twin evolves, instead of committing up front to one data standard or solution strategy.
     
    Read more...
    Introduction 
    The Strategic Pipeline Alliance (SPA) was established to deliver a major part of Anglian Water’s ‘Water Resources Management Plan’ to safeguard against the potential future impacts of water scarcity, climate change and growth, whilst protecting and enhancing the environment. The SPA was established to deliver up to 500km of large diameter interconnecting transmission pipelines, associated assets and a Digital Twin.  
    Digital transformation was identified early in the programme as a core foundational requirement for the alliance to run its ‘business’ effectively and efficiently. It will take Anglian Water through a digital transformation in the creation of a smart water system, using a geospatial information system as a core component of the common data environment (CDE), enabling collaboration and visualisation in this Project 13 Enterprise. 
     
    Digital Transformation 
    Our geospatial information system (GIS) described is just one part of a wider digital transformation approach that SPA has been developing and is a step change in the way that Anglian Water uses spatial data to collaborate and make key decisions, with net savings of £1m identified.  
    When the newly formed SPA went from an office-based organisation to a home-based organisation overnight due to COVID19, standing up an effective central GIS system was critical to maintain the ability to work efficiently, by providing a common window to the complex data environment to all users. With 500km of land parcels and around 5000 stakeholders to liaise with, the GIS system provided the central data repository as well as landowner and stakeholder relationship management. The mobile device applications, land management system, ground investigation solution and ecology mapping processes all enabled SPA to hit its key consenting and EIA (Environmental Impact Assessment) application dates.   
    We got the Alliance in place and fully operative within six months and the SPA GIS has helped fast-track a key SPA goal of increasing automation throughout the project lifecycle; automation tools such as FME (Feature Manipulation Engine), Python and Model Builder have been widely adopted, driving efficiencies.   
    The SPA GIS analyses and visually displays geographically referenced information. It uses data that is attached to a unique location and enables users to collaborate and visualise near real time information. Digital optimisation will provide enormous value and efficiencies in engineering, production, and operational costs of the smart water system. Having a single repository of up-to-date core project geospatial deliverables and information has reduced risk and enabled domain experts and our supply chain to interact with data efficiently.  
     
    Enterprise Architecture 
    Spending quality time up front in developing an enterprise architecture and data model allowed us to develop a CDE based around GIS. A cost model was approved for the full five years, and the platform was successfully rolled out. 
    The Enterprise Architecture model was created in a repository linked to Anglian Water’s enterprise. This included mapping out the technology and data integration requirements, as well as the full end-to-end business processes. The result was a consistent, interoperable solution stack that could be used by all alliance partners, avoiding costly duplication. GIS was identified as a key method of integrating data from a wide range of different sources, helping to improve access across the alliance to single version of the truth and improving confidence in data quality. In addition, a fully attributed spatial data model was developed representing the physical assets. This will help support future operations and maintenance use cases that monitor asset performance. 
     
    Benefits 
    The use of our GIS system is enabling SPA to meet its obligations around planning applications and obtaining landowner consent to survey, inspect and construct the strategic pipeline. Hundreds of Gb of data had to be collected, analysed, and managed to create our submissions.  
    The SPA GIS provides secure, consistent, and rapid access to large volumes of geospatial data in a single repository. Using a common ‘web-centric’ application, the solution enables teams to cooperate on location-based data, ensuring its 700+ users can access current and accurate information. The intuitive interface, combined with unlimited user access, has enabled the Alliance to rapidly scale without restriction.  We have also enabled the functionality for desktop software (ESRI ArcPro, QGIS, FME, AutoDesk CAD and Civil3D) to connect to the geodatabase to allow specialist users to work with the data in the managed, controlled environment, including our supply chain partners. 
    The integration of SPA Land Management and SPA GIS in one platform has brought advantages to stakeholder relationship management by enabling engagement to be reviewed spatially.  
    SPA’s integrated geospatial digital system has been the go-to resource for the diverse and complex teams. The use of our GIS system has been used to extensively engage with the wider Anglian Water operational teams, enabling greater collaboration and understanding of the complex system. The GIS system has, in part, enabled SPA to remove the need to construct over 100km of pipeline, instead re-using existing assets that have been identified in the GIS solution, contributing to the 63% reduction in forecast capital carbon, compared to the baseline.  
    The SPA Land Management solution incorporates four core areas: land ownership, land access survey management and stakeholder relationship management (developed by SPA) which puts stakeholder and customer engagement at its heart. With 300 unique land access users, traditionally, these areas would be looked after by separate teams, with separate systems which struggle to share data. With the digital tool, land and engagement data can be shared across SPA, creating a single source of truth, mitigating risk across the whole infrastructure programme. This has benefitted our customers, as engagement with them is managed much more effectively. Our customer sentiment surveys show 98% are satisfied with how we are communicating with them.  
    The Enterprise Architecture solution allows for capabilities to be transferred into Anglian Water’s enterprise, and there has been careful consideration around ensuring the value of data collected during the project is retained. SPA is developing blueprints as part of the outputs to enable future Alliances to align with best practices, data, cyber and technology policies. SPA is also focussing on developing the cultural and behavioural aspects with Anglian Water to enable Anglian to be able to accept the technological changes as part of this digital transformation. This is a substantial benefit and enables Anglian Water to continue to work towards its operator of the future ambitions, where digital technologies and human interfaces will delivery higher levels of operational excellence.  
    Read more...
    Article written by :- Ilnaz Ashayeri - University of Wolverhampton | Jack Goulding - University of Wolverhampton
    STELLAR provides new tools and business models to deliver affordable homes across the UK at the point of housing need. This concept centralises and optimises complex design, frame manufacturing and certification within a central 'hub'; where 'spoke' factories engage their expertise through the SME-driven supply chain. This approach originated from the airline industry in the 1950’s, where the rationale of this optimises process and logistic distribution. STELLAR takes this one step further by creating a bespoke offsite ‘hub and spoke’ model which is purposefully designed to deliver maximum efficiency savings and end-product value. This arrangement is demonstrated through three central tenets: 1) 3D 'digital twin' factory planning tool; 2) Parametric modelling tool (to optimise house design); and 3) OSM Should-Cost model (designed specifically for the offsite market). 
     
    STELLAR Digital Twin hub article.pdf
    Read more...
Top
×
×
  • Create New...